Multiple Choice

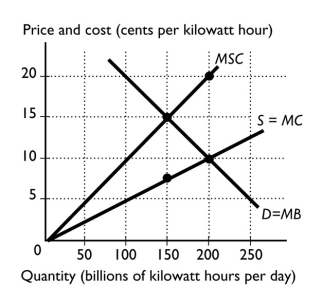
-The figure above shows the marginal social cost curve of generating electricity,the marginal private cost curve,and the demand curve.The marginal external cost of producing 200 billion kilowatt hours per day is ________ per kilowatt.
A) 0¢
B) 10¢
C) 20¢
D) 15¢
E) 5¢
Correct Answer:

Verified
Correct Answer:
Verified
Q1: <img src="https://d2lvgg3v3hfg70.cloudfront.net/TB1458/.jpg" alt=" -The figure above
Q2: <img src="https://d2lvgg3v3hfg70.cloudfront.net/TB1458/.jpg" alt=" -The figure above
Q3: An externality can be a cost or
Q5: <img src="https://d2lvgg3v3hfg70.cloudfront.net/TB1458/.jpg" alt=" The figure
Q7: Food stamps provided by the government to
Q8: A tax on a polluting industry<br>A) is
Q9: <img src="https://d2lvgg3v3hfg70.cloudfront.net/TB1458/.jpg" alt=" -The figure above
Q10: Suppose unregulated production of pesticides results in
Q11: Which of the following is the best
Q27: Describe some of the external benefits associated