Multiple Choice

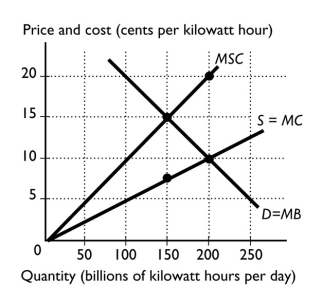
-The figure above shows the marginal social cost curve of generating electricity,the marginal private cost curve,and the demand curve.If the market is competitive and unregulated,the equilibrium quantity is ________ billion kilowatt hours per day and the efficient quantity is ________ billion kilowatt hours per day
A) 150; 200
B) 200; 150
C) 0; 150
D) 250; 0
E) 150; 150
Correct Answer:

Verified
Correct Answer:
Verified
Q128: A example of a good with external
Q129: <img src="https://d2lvgg3v3hfg70.cloudfront.net/TB1458/.jpg" alt=" -The figure above
Q130: <img src="https://d2lvgg3v3hfg70.cloudfront.net/TB1458/.jpg" alt=" -The figure above
Q131: Transactions costs are the<br>A) costs of using
Q132: Based on the figure above,if the factory
Q134: When using pollution charges to improve efficiency
Q135: <img src="https://d2lvgg3v3hfg70.cloudfront.net/TB1458/.jpg" alt=" -The above figure
Q136: External benefits are the extra<br>A) benefits a
Q137: <img src="https://d2lvgg3v3hfg70.cloudfront.net/TB1458/.jpg" alt=" -The figure above
Q138: When the government uses a private subsidy