Multiple Choice
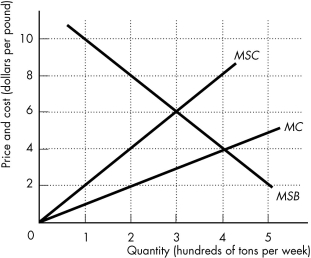
-The above figure shows the marginal private cost curve,marginal social cost curve,and marginal social benefit curve for cod,a common resource.A quota to prevent the overuse of the cod sets the catch equal to ________.
A) 0 tons per week
B) 200 tons per week
C) 400 tons per week
D) 300 tons per week
E) 500 tons per week
Correct Answer:

Verified
Correct Answer:
Verified
Q100: Which of the following goods is excludable
Q101: National defense is a _ because _.<br>A)
Q102: Which of the following can be rival
Q103: Suppose Burger King builds a new store
Q104: When someone enjoys the benefit of a
Q106: One reason the size of the government
Q107: If a good or resource is rival,it
Q108: The principle of minimum differentiation describes a
Q109: Marginal cost curves for public goods are
Q110: Suppose a public good is provided in