Essay
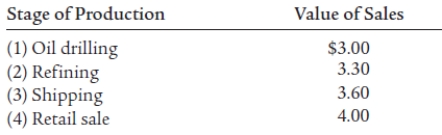
Figure 21.1
-Use Figure 21.1 which is a hypothetical production table showing the value of sales at each stage. From this information create a separate column showing the value added and determine the amount of that would be added to the official GDP of one gallon of gasoline.
Correct Answer:

Verified

The amount that would be adde...View Answer
Unlock this answer now
Get Access to more Verified Answers free of charge
Correct Answer:
Verified
The amount that would be adde...
View Answer
Unlock this answer now
Get Access to more Verified Answers free of charge
Q23: How is the capital stock at the
Q24: <img src="https://d2lvgg3v3hfg70.cloudfront.net/TB2925/.jpg" alt=" Table 6. 1
Q25: A demographer discovers that more mothers are
Q26: <img src="https://d2lvgg3v3hfg70.cloudfront.net/TB2925/.jpg" alt=" -Using the above
Q27: Explain and define NNP.<br>
Q29: Next to each of the following items
Q30: If NNP is $7 trillion, net investment
Q31: How are interest payments by households and
Q32: Briefly explain under what condition, if any,
Q33: <img src="https://d2lvgg3v3hfg70.cloudfront.net/TB2925/.jpg" alt=" Table 6. 1