Essay
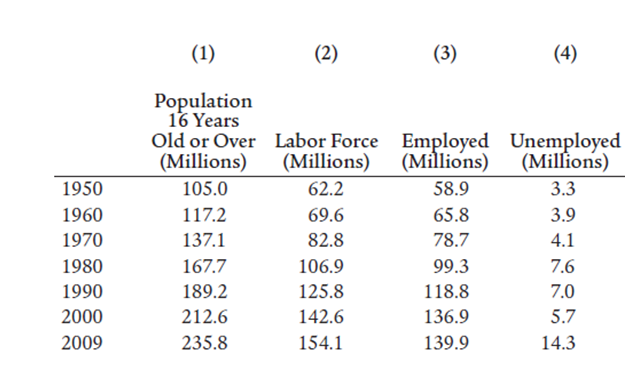
Figure 22.1
-Using Figure 22.1 calcuulate the unemployment rate in each of the years between 1950 and 2009.
Correct Answer:

Verified

The unemployment rate is calc...View Answer
Unlock this answer now
Get Access to more Verified Answers free of charge
Correct Answer:
Verified
The unemployment rate is calc...
View Answer
Unlock this answer now
Get Access to more Verified Answers free of charge
Related Questions
Q71: For the United States, explain why the
Q72: Explain the three different types of unemployment.
Q73: Table 7.2<br> <img src="https://d2lvgg3v3hfg70.cloudfront.net/TB2925/.jpg" alt="Table 7.2
Q74: Assume the number of people employed is
Q75: Explain how labor productivity is measured.
Q76: If the national unemployment rate is 7%,
Q77: Explain why it might be a fruitless
Q78: Explain how inflation might actually provide an
Q79: Suppose there are 10 million unemployed out
Q81: How can inflation and recession both reduce