Essay
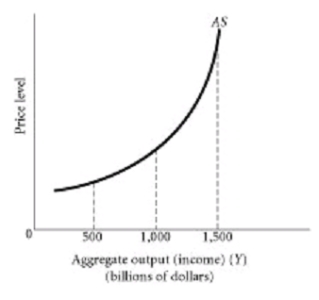
-Using the graph above, between the output levels of $500 billion and $1500 billion what is the relationship between the price level and aggregate output?
Correct Answer:

Verified
Correct Answer:
Verified
Related Questions
Q1: Suppose the economy is initially operating at
Q3: Assume the Congress passes legislation to spend
Q4: If inflation is really a monetary phenomena
Q5: What is the general economic view regarding
Q6: Show the effect on the price level
Q7: Explain demand-pull inflation
Q8: What is the likely impact of expansionary
Q9: Explain the difference between demand-pull inflation and
Q10: Explain why costs shocks are bad news
Q11: Explain why the AS curve cannot be