Essay
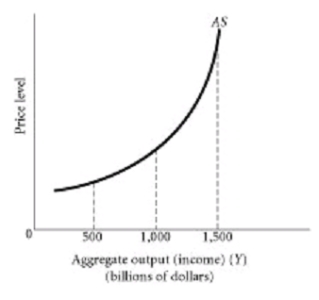
-Using the graph above, at aggregate output levels above $1500 billion what is happening to both costs and prices?
Correct Answer:

Verified
In this region costs...View Answer
Unlock this answer now
Get Access to more Verified Answers free of charge
Correct Answer:
Verified
View Answer
Unlock this answer now
Get Access to more Verified Answers free of charge
Q20: Draw an aggregate supply curve in which
Q21: Explain what is meant by potential output.
Q22: <img src="https://d2lvgg3v3hfg70.cloudfront.net/TB2925/.jpg" alt=" -Using the above
Q23: <img src="https://d2lvgg3v3hfg70.cloudfront.net/TB2925/.jpg" alt=" -Using the above
Q24: Using aggregate supply and aggregate demand analysis
Q26: Explain why a sustained inflation must be
Q27: At what point might the aggregate supply
Q28: Coal is used as a source of
Q29: Show using graphs and explain what is
Q30: If input prices are increasing at the