Essay
Monetary and Fiscal Policy Effects
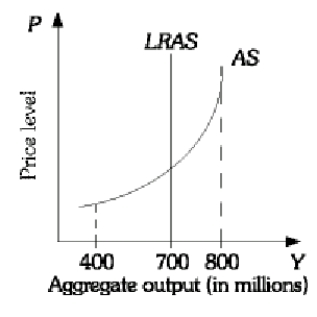
-Using the above graph, which output level is is considered potential output? Explain.
Correct Answer:

Verified
$700 million would be consider...View Answer
Unlock this answer now
Get Access to more Verified Answers free of charge
Correct Answer:
Verified
View Answer
Unlock this answer now
Get Access to more Verified Answers free of charge
Q76: Explain why the aggregate supply curve is
Q77: Assume the Federal Reserve Bank chairman implores
Q78: Assuming that the Fed takes no action
Q79: Draw the short-run aggregate supply and long-run
Q80: Explain why the aggregate supply curve is
Q82: Could a high degree of monopoly power
Q83: <img src="https://d2lvgg3v3hfg70.cloudfront.net/TB2925/.jpg" alt=" -Using the graph
Q84: Define cost-push inflation. Using an AS/AD diagram,
Q85: Graphically illustrate and explain the aggregate supply
Q86: Explain how expectations can affect the price