Essay
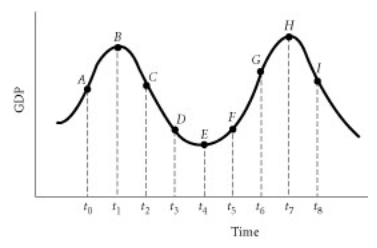
-Using the graph above, suppose it takes policy makers from time t2 to time t4 to take an action to stimulate the economy. What kind of policy lag is this and why does it happen?
Correct Answer:

Verified
This is an example of an implementation ...View Answer
Unlock this answer now
Get Access to more Verified Answers free of charge
Correct Answer:
Verified
View Answer
Unlock this answer now
Get Access to more Verified Answers free of charge
Q43: Explain the "balanced-budget amendment." Why are many
Q44: What does the recognition lag imply about
Q45: If an increase in government spending had
Q46: What is the deficit response index?
Q47: What happens to the deficit, when government
Q49: Explain how deficit targeting can serve as
Q50: Explain why the implementation lag for fiscal
Q51: Suppose the government is faced with a
Q52: <img src="https://d2lvgg3v3hfg70.cloudfront.net/TB2925/.jpg" alt=" -Using the graph
Q53: Discuss the response lags for an expansionary