Multiple Choice
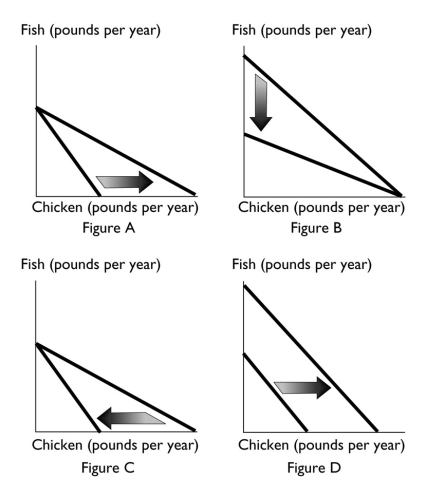
-Which of the above figures reflects an increase in the price of chicken?
A) Figure A
B) Figure B
C) Figure C
D) Figure D
E) Both Figure B and Figure C
Correct Answer:

Verified
Correct Answer:
Verified
Related Questions
Q162: Marginal utility is equal to which of
Q163: A relative price is the<br>A) price of
Q164: To maximize utility,why does a consumer consume
Q165: Reb buys fishing lures and steaks.If his
Q166: Gertrude has a $15 budget to spend
Q168: In a budget line/indifference curve diagram,at the
Q169: An indifference curve is a line that
Q170: <img src="https://d2lvgg3v3hfg70.cloudfront.net/TB1458/.jpg" alt=" The figure
Q171: Points on a demand curve<br>A) reflect best
Q172: The point where an indifference curve just