Multiple Choice
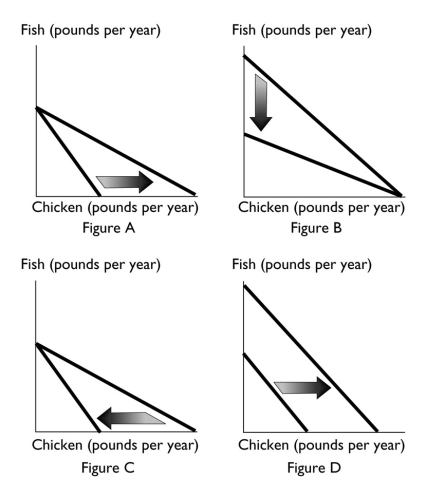
-Which of the above figures reflects a decrease in the price of chicken?
A) Figure A
B) Figure B
C) Figure C
D) Figure D
E) Both Figure A and Figure D
Correct Answer:

Verified
Correct Answer:
Verified
Q196: Bottles of Soda Slices of Pizza<br> <img src="https://d2lvgg3v3hfg70.cloudfront.net/TB1458/.jpg"
Q197: <img src="https://d2lvgg3v3hfg70.cloudfront.net/TB1458/.jpg" alt=" -The table above
Q199: Juan's marginal utility from strawberries is 200
Q200: <img src="https://d2lvgg3v3hfg70.cloudfront.net/TB1458/.jpg" alt=" -The above table
Q202: <img src="https://d2lvgg3v3hfg70.cloudfront.net/TB1458/.jpg" alt=" -The figure above
Q203: You can use marginal utility theory to
Q204: Reb earns $1,000 per week as a
Q205: <img src="https://d2lvgg3v3hfg70.cloudfront.net/TB1458/.jpg" alt=" -George has a
Q206: When the price of one good changes
Q354: You are studying with a friend, and