Essay
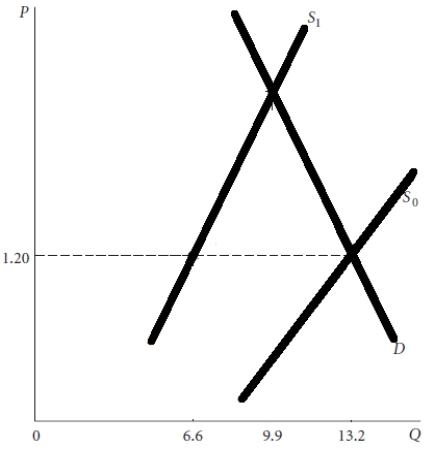
Using the diagram below explain what will happen to equilibrium price and quantity if the supply curve shifts to the left as depicted from So to S2.
Correct Answer:

Verified
The equilibrium price will ris...View Answer
Unlock this answer now
Get Access to more Verified Answers free of charge
Correct Answer:
Verified
The equilibrium price will ris...
View Answer
Unlock this answer now
Get Access to more Verified Answers free of charge
Related Questions
Q42: Assume that you are currently making $15,000
Q43: List and describe three different input markets.
Q44: SCENARIO 1: Consider the market for generic
Q45: Draw a supply curve for a hypothetical
Q46: Explain the law of supply. What does
Q48: Define what a firm is and its
Q49: A decrease in the demand for eggs
Q50: Suppose you want to buy a popular
Q51: Suppose that the demand for good Y
Q52: In 1999, both the equilibrium price and