menu-iconExamlexExamLexServices

Discover

Ask a Question
  1. All Topics
  2. Topic
    Business
  3. Study Set
    Principles of Macroeconomics Study Set 11
  4. Exam
    Exam 1: The Scope and Method of Economics
  5. Question
    Graph the Relationship Between Variables X and Y According to the Table
Solved

Graph the Relationship Between Variables X and Y According to the Table

Question 37

Question 37

Essay

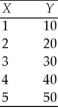
Graph the relationship between variables X and Y according to the table below:

Correct Answer:

verifed

Verified

Unlock this answer now
Get Access to more Verified Answers free of charge

Related Questions

Q32: Assume that at very low tax rates

Q33: Explain how to calculate the slope of

Q34: Define an efficient market.

Q35: Create a time series graph with the

Q36: Most economists will argue that the minimum

Q38: Explain what is meant by allocative efficiency.

Q39: Describe what is meant by the Cartesian

Q40: Your younger brother likes to yell at

Q41: Describe what took place during the Industrial

Q42: Explain the difference between positive economics and

Examlex

ExamLex

About UsContact UsPerks CenterHomeschoolingTest Prep

Work With Us

Campus RepresentativeInfluencers

Links

FaqPricingChrome Extension

Download The App

Get App StoreGet Google Play

Policies

Privacy PolicyTerms of ServiceHonor CodeCommunity Guidelines

Scan To Download

qr-code

Copyright © (2025) ExamLex LLC.

Privacy PolicyTerms Of ServiceHonor CodeCommunity Guidelines