Multiple Choice
Refer to the information provided in Table 21.3 below to answer the questions that follow.
Table 21.3
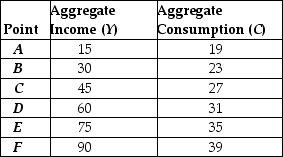 The data in the table was used to estimate the following consumption function: C = 20 + 0.2Y.
-Refer to Table 21.3. Which of the following points is (are) the worst fit for the given consumption function?
A) A
B) D and F
C) E
D) F
Correct Answer:

Verified
Correct Answer:
Verified
Q7: Assuming the effect of a specific outcome
Q17: Refer to the information provided in Table
Q20: Refer to the information provided in Table
Q21: Refer to the information provided in Table
Q22: Refer to the information provided in Table
Q30: Selection bias can distort the results of
Q36: Most theories in economics are based on
Q40: Correlation always implies causation.
Q82: Suppose that a study is released stating
Q91: When computing p-values,<br>A) the size of the