Multiple Choice
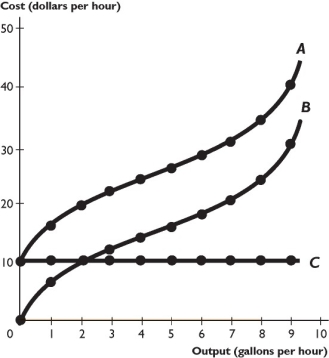
The figure above shows some of a firm's cost curves.
-Based on the figure above,curve C is the firm's
A) marginal cost curve.
B) total cost curve.
C) average total cost curve.
D) total variable cost curve.
E) total fixed cost curve.
Correct Answer:

Verified
Correct Answer:
Verified
Q39: When plotted against the total output, what
Q81: Which of the following is a fixed
Q82: If average variable costs increase as output
Q83: <img src="https://d2lvgg3v3hfg70.cloudfront.net/TB1458/.jpg" alt=" -Anna owns a
Q84: Average product is equal to<br>A) marginal product
Q85: Cost curves shift if<br>i.technology changes.<br>ii.the prices of
Q88: From a firm's viewpoint,opportunity cost is the<br>A)
Q89: <img src="https://d2lvgg3v3hfg70.cloudfront.net/TB1458/.jpg" alt=" -The table above
Q90: _ cost is defined as a cost
Q91: Marginal cost<br>A) is the difference between total