Multiple Choice
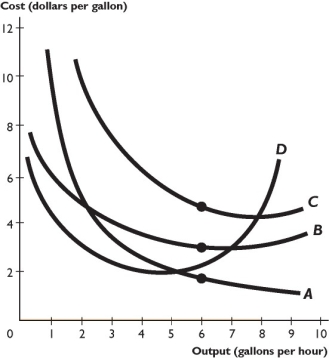
The figure above shows some of a firm's cost curves.
-Based on the figure above,curve B is the firm's
A) marginal cost curve.
B) total cost curve.
C) average total cost curve.
D) average variable cost curve.
E) average fixed cost curve.
Correct Answer:

Verified
Correct Answer:
Verified
Q96: Jake opens a pig farm in Idaho.
Q100: In the long run,if 1,000 units are
Q101: Moving along the total product curve,which of
Q102: When marginal cost is positive,total cost is
Q103: The long run average cost curve<br>A) is
Q104: <img src="https://d2lvgg3v3hfg70.cloudfront.net/TB1458/.jpg" alt=" -The above table
Q107: A cost incurred in the production of
Q109: <img src="https://d2lvgg3v3hfg70.cloudfront.net/TB1458/.jpg" alt=" -The table above
Q110: If a firm does not produce any
Q490: <img src="https://d2lvgg3v3hfg70.cloudfront.net/TB8586/.jpg" alt=" -The above table