Multiple Choice
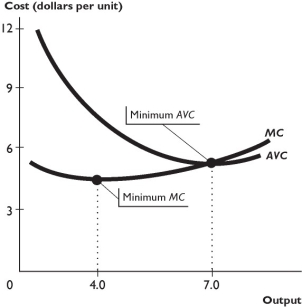
The figure above shows a firm's average total cost and marginal cost curves.
-Based on the figure above,the firm's marginal product curve slopes upward at levels of output between ________ and the firm's average product curve slopes upward at levels of output between ________.
A) 4.0 and 7.0; 4.0 and 7.0
B) 0 and 7.0; 4.0 and 7.0
C) 4.0 and 7.0; 0 and 4.0
D) 0 and 4.0; 0 and 7.0
E) More information is needed to answer the question.
Correct Answer:

Verified
Correct Answer:
Verified
Q192: Acme produces rocket shoes for use by
Q193: Average variable cost equals<br>A) fixed cost divided
Q194: <img src="https://d2lvgg3v3hfg70.cloudfront.net/TB1458/.jpg" alt=" -Paulette owns a
Q195: When the marginal product is increasing as
Q196: Increasing marginal returns occur when the<br>A) average
Q198: Marginal cost equals<br>A) total cost minus total
Q199: In the long run,the firm _ change
Q200: The difference between a firm's total revenue
Q201: Jessica is a young doctor who has
Q202: Which of the following curves are U-shaped?<br>i.average