Multiple Choice
Refer to the information provided in Figure 13.4 below to answer the questions that follow. 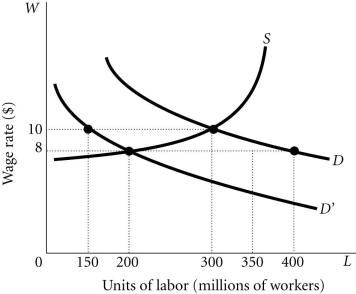 Figure 13.4
-Refer to Figure 13.4. Suppose there is a decrease in the fertility rate and this causes some men and women to place a lower value on their time spent in nonmarket activities. This will cause
A) the labor supply curve to shift to the left of S.
B) the labor supply curve to shift to the right of S.
C) the labor demand curve to shift from D to D'.
D) the labor demand curve to shift from D' to D.
Correct Answer:

Verified
Correct Answer:
Verified
Q58: If the AS curve shifts from year
Q59: Martin is not employed. The value Martin
Q60: One of the tenets of the classical
Q61: Cyclical unemployment<br>A) arises from recessions.<br>B) is due
Q62: Suppose the wage rate in the labor
Q64: The economy experiences both inflation and unemployment
Q65: Efficiency wages may lower employee turnover.
Q66: Refer to the information provided in Figure
Q67: If firms set wages too high, the
Q68: Economists who argue that the AS curve