Multiple Choice
Refer to the information provided in Figure 13.4 below to answer the questions that follow. 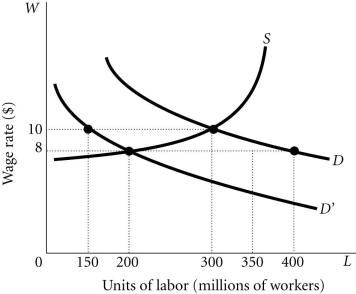 Figure 13.4
-Refer to Figure 13.4. Suppose there is an increase in the fertility rate and this causes some men and women to place a higher value on their time spent in non-market activities. This will cause
A) the labor supply curve to shift to the left of S.
B) the labor supply curve to shift to the right of S.
C) the labor demand curve to shift from D to D'.
D) the labor demand curve to shift from D' to D.
Correct Answer:

Verified
Correct Answer:
Verified
Q98: Efficiency wage theory suggests that firms may
Q99: The classical view of the labor market
Q100: If aggregate demand changes when aggregate supply
Q101: The minimum wage law contributes to a<br>A)
Q102: Suppose that air traffic controllers, whose wages
Q104: According to the classical theory, a contractionary
Q105: Which of the following arguments is not
Q106: Lisa is currently not employed. She places
Q107: Refer to the information provided in Figure
Q108: Refer to the information provided in Figure