Multiple Choice
Refer to the information provided in Figure 11.1 below to answer the questions that follow. 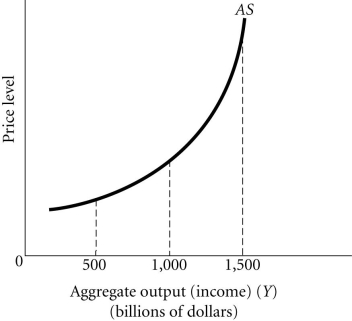 Figure 11.1
-Refer to Figure 11.1. This economy is most likely experiencing excess capacity at aggregate output levels
A) above $1,500 billion.
B) between $1,000 billion and $1,500 billion.
C) between $500 billion and $1,000 billion.
D) below $500 billion.
Correct Answer:

Verified
Correct Answer:
Verified
Q34: 11.5 The Long-Run AS Curve<br>Refer to the
Q35: A decrease in government spending shifts aggregate
Q36: The aggregate demand curve is the sum
Q37: Related to the Economics in Practice on
Q38: An increase in aggregate demand when the
Q40: When the interest rate is low, planned
Q41: Which of the following causes a movement
Q42: 11.3 The Final Equilibrium<br>Refer to the information
Q43: _ shifts the IS curve to the
Q44: The Federal Reserve's policy to "lean against