Multiple Choice
Refer to the information provided in Figure 11.2 below to answer the questions that follow. 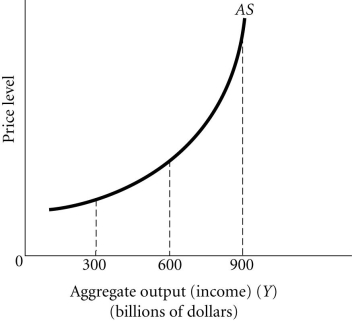 Figure 11.2
-Refer to Figure 11.2. Between the output levels of $300 billion and $600 billion, the relationship between the price level and output is
A) negative.
B) positive.
C) constant.
D) There is no relationship between the price level and output.
Correct Answer:

Verified
Correct Answer:
Verified
Q175: The slope of the _ is negative
Q176: Refer to the information provided in Figure
Q177: The aggregate demand curve slopes downward because
Q178: If _ equilibrium output _ , the
Q179: Refer to the information provided in Figure
Q181: Refer to the information provided in Figure
Q182: Refer to the information provided in Figure
Q183: Refer to the information provided in Figure
Q184: When the economy is producing at full
Q185: Refer to the information provided in Figure