Multiple Choice
Refer to the information provided in Figure 11.2 below to answer the questions that follow. 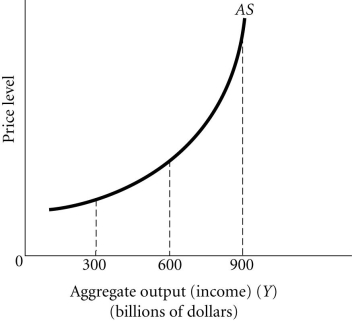 Figure 11.2
-Refer to Figure 11.2. Between the output levels of $600 billion and $900 billion, the relationship between the price level and output is
A) negative.
B) positive.
C) constant.
D) there is no relationship between the price level and output
Correct Answer:

Verified
Correct Answer:
Verified
Q56: The aggregate demand curve shows that, ceteris
Q57: An increase in the price of inputs
Q58: The quantity of output supplied at different
Q59: 11.5 The Long-Run AS Curve<br>Refer to the
Q60: All else equal, when output is low,
Q62: Related to the Economics in Practice on
Q63: If _ equilibrium output _, the price
Q64: If wages do not fully adjust to
Q65: When the _ decreases, then potential output
Q66: The Fed rule shows combinations of income