Multiple Choice
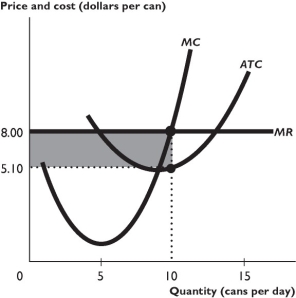
The figure above shows some of a firm's cost curves and its marginal revenue curve.
-Suppose the price of a can was $5.10.In this case,to maximize its profit,the firm illustrated in the figure above would
A) decrease its production and would make an economic profit.
B) not change its production and would make zero economic profit.
C) not change its production and would make an economic profit.
D) decrease its production and would incur an economic loss.
E) not change its production and would incur an economic loss.
Correct Answer:

Verified
Correct Answer:
Verified
Q112: John keeps beehives and sells 100 quarts
Q125: Technological change brings a _ to firms
Q126: A perfectly competitive firm should shut down
Q127: <img src="https://d2lvgg3v3hfg70.cloudfront.net/TB1458/.jpg" alt=" -The above figure
Q128: In the long run,a perfectly competitive firm
Q129: The largest loss a profit-maximizing perfectly competitive
Q132: If it does not shut down,a perfectly
Q135: In the long run,perfectly competitive firms produce
Q387: <img src="https://d2lvgg3v3hfg70.cloudfront.net/TB8586/.jpg" alt=" -Acme is a
Q423: Can a perfectly competitive firm make an