Multiple Choice
Refer to the information provided in Figure 8.5 below to answer the questions that follow. 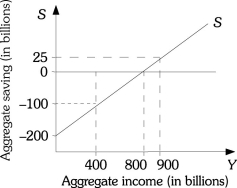 Figure 8.5
-Refer to Figure 8.5. In this graph, 0.25 represents this society's
A) MPC.
B) MPS.
C) saving function.
D) consumption function.
Correct Answer:

Verified
Correct Answer:
Verified
Q82: Refer to the information provided in Figure
Q83: An increase in planned investment causes<br>A) output
Q84: The MPC is<br>A) the change in consumption
Q85: Refer to the information provided in Figure
Q86: Actual investment equals planned investment plus unplanned
Q88: Refer to the information provided in Figure
Q89: Refer to the information provided in Figure
Q90: If planned investment is perfectly unresponsive to
Q91: When there is an unplanned draw down
Q92: If the consumption function is of the