Multiple Choice
Refer to the information provided in Figure 8.9 below to answer the questions that follow. 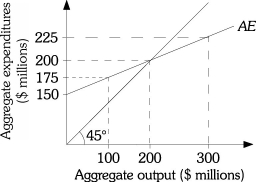 Figure 8.9
-Refer to Figure 8.9. There is a $75 million increase in unplanned inventories at an aggregate output level of
A) $100 million.
B) $200 million.
C) $300 million.
D) > $300 million.
Correct Answer:

Verified
Correct Answer:
Verified
Q51: Suppose consumption is $5,000 when income is
Q52: Refer to the information provided in Figure
Q53: If the MPS is 0.25, then the
Q54: Refer to the information provided in Table
Q55: Related to the Economics in Practice on
Q57: Refer to the information provided in Table
Q58: Related to the Economics in Practice on
Q59: The change in saving divided by the
Q60: Refer to the information provided in Figure
Q61: Refer to the information provided in Figure