Short Answer
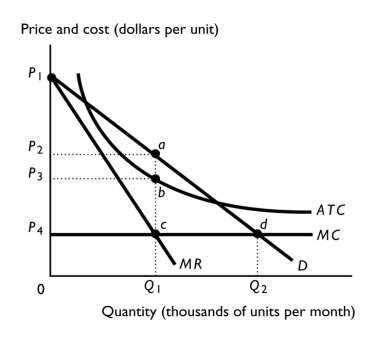
-The above figure shows the demand,marginal revenue,and cost curves for a natural monopoly.
a.Which price and quantity is set if the capture theory is correct?
b.If production is at the price and quantity specified in part (a),what area represents the economic profit?
c.If production is at the price and quantity specified in part (a),what area represents the deadweight loss?
d.If production is at the price and quantity specified in part (a),what area represents the consumer surplus?
Correct Answer:

Verified
a.The profit-maximizing price and quanti...View Answer
Unlock this answer now
Get Access to more Verified Answers free of charge
Correct Answer:
Verified
View Answer
Unlock this answer now
Get Access to more Verified Answers free of charge
Q309: For a natural monopoly to cover its
Q310: A single-price monopoly can sell 1 unit
Q312: Which of the following industries is most
Q313: <img src="https://d2lvgg3v3hfg70.cloudfront.net/TB1458/.jpg" alt=" The above
Q315: <img src="https://d2lvgg3v3hfg70.cloudfront.net/TB1458/.jpg" alt=" -A monopolist has
Q316: Which of the following statements is correct?<br>A)
Q317: What problem is caused by subsidizing a
Q318: <img src="https://d2lvgg3v3hfg70.cloudfront.net/TB1458/.jpg" alt=" -Suppose the grocery
Q445: When a natural monopoly is regulated using
Q596: <img src="https://d2lvgg3v3hfg70.cloudfront.net/TB8586/.jpg" alt=" -The above figure