Multiple Choice
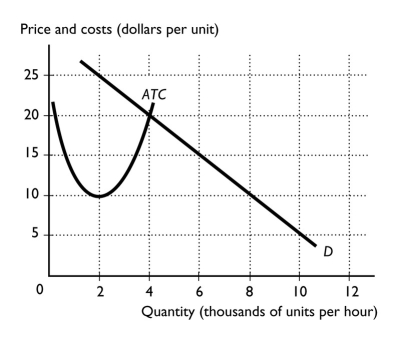
-The figure above shows the market demand curve and the ATC curve for a firm.If all firms in the market have the same ATC curve,the figure shows a ________ can profitably operate.
A) natural monopoly in which 1 firm
B) natural oligopoly in which 2 firms
C) natural oligopoly in which 3 firms
D) natural oligopoly in which 4 firms
E) natural oligopoly in which 5 or more firms
Correct Answer:

Verified
Correct Answer:
Verified
Q44: OPEC, the Organization of Petroleum Exporting Countries,
Q143: A Nash equilibrium is defined as<br>A) making
Q144: <img src="https://d2lvgg3v3hfg70.cloudfront.net/TB1458/.jpg" alt=" -A market has
Q145: <img src="https://d2lvgg3v3hfg70.cloudfront.net/TB1458/.jpg" alt=" -Suppose two companies,Sony
Q146: A Nash equilibrium in the duopoly game<br>A)
Q149: <img src="https://d2lvgg3v3hfg70.cloudfront.net/TB1458/.jpg" alt=" -The above figure
Q150: A cartel is most likely to occur
Q151: Which of the following does antitrust law
Q152: The prisoners' dilemma game<br>A) shows that prisoners
Q257: If Sony required all its retailers not