Multiple Choice
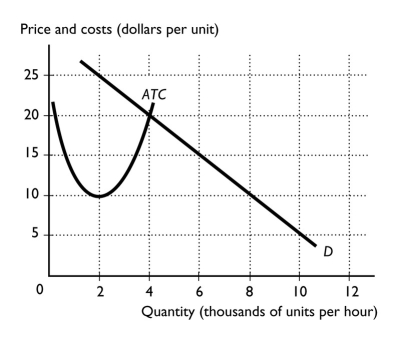
-The figure above shows the market demand curve and the ATC curve for a firm.If all firms in the market have the same ATC curve,economies of scale limit the market to ________ firm(s) .
A) 1
B) 2
C) 3
D) 4
E) 8
Correct Answer:

Verified
Correct Answer:
Verified
Q99: Explain how the courts have ruled on
Q218: <img src="https://d2lvgg3v3hfg70.cloudfront.net/TB1458/.jpg" alt=" -The above figure
Q219: Suppose that an industry has an HHI
Q220: Why are cartels among firms usually kept
Q221: Resale price maintenance can be illegal<br>A) under
Q222: What three characteristics do all games have
Q223: The major dilemma facing Boeing and Airbus
Q224: <img src="https://d2lvgg3v3hfg70.cloudfront.net/TB1458/.jpg" alt=" -Suppose Intel and
Q225: Oligopoly is a market structure in which<br>A)
Q228: A Nash equilibrium occurs<br>A) when each player