Multiple Choice
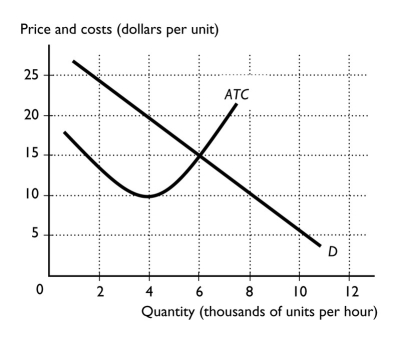
-The figure above shows the market demand curve and the ATC curve for a firm.If all firms in the market have the same ATC curve,the figure shows a ________ can profitably operate.
A) natural monopoly in which 1 firm
B) natural monopoly in which 2 firms
C) natural oligopoly in which 3 firms
D) natural oligopoly in which 2 firms
E) natural oligopoly in which 8 firms
Correct Answer:

Verified
Correct Answer:
Verified
Q101: Daryl's Inc.has formed a cartel with the
Q102: In 1911,Standard Oil Co.was declared a monopoly
Q103: If an industry has a Herfindahl-Hirschman index
Q104: Under the Clayton Act and its amendments,which
Q105: Which of the following is an example
Q107: <img src="https://d2lvgg3v3hfg70.cloudfront.net/TB1458/.jpg" alt=" -Two firms are
Q108: <img src="https://d2lvgg3v3hfg70.cloudfront.net/TB1458/.jpg" alt=" -The figure above
Q109: When an oligopoly reduces its price with
Q110: In order for the Federal Trade Commission
Q111: The range in which a duopoly's output