Multiple Choice
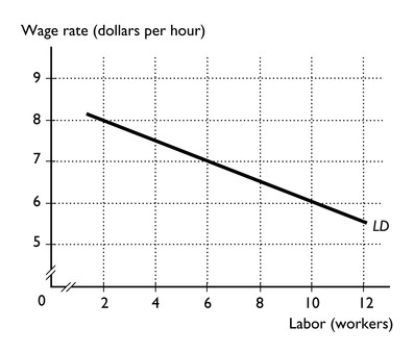
-The above figure shows the initial demand for labor curve at a Pizza Hut in Canada.The wage rate is $6 an hour.If the demand for pizzas increases so that the price of a pizza rises,
A) at the wage rate of $6 per hour, Pizza Hut hires fewer than 10 workers.
B) Pizza Hut's demand for labor curve shifts rightward.
C) the supply of labor curve shifts rightward.
D) Pizza Hut's demand for labor curve shifts leftward.
E) the supply of labor curve shifts leftward.
Correct Answer:

Verified
Correct Answer:
Verified
Q14: Which of the following is a method
Q15: If the price of movie tickets increases,there
Q16: Which of the following statements about a
Q17: Which of the following methods is used
Q18: If the demand for a good increases,the
Q20: Unions support immigration restrictions because the restrictions
Q21: <img src="https://d2lvgg3v3hfg70.cloudfront.net/TB1458/.jpg" alt=" -The table above
Q23: Suppose Mongo runs a glue factory in
Q24: The Small Bookshop hires teenagers who love
Q301: "As the quantity of labor hired increases,