Multiple Choice
The graph represents the straight line motion of a car. How far does the car travel between t = 2 seconds and t = 5 seconds? 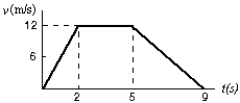
A) 4 m
B) 12 m
C) 24 m
D) 36 m
E) 60 m
Correct Answer:

Verified
Correct Answer:
Verified
Related Questions
Q15: A drag racing car starts from rest
Q19: A car moving with an initial velocity
Q22: A car travels 40 kilometers at an
Q23: The coordinate of a particle in meters
Q25: An object is dropped from rest. Which
Q28: A ball rolls up a slope. At
Q30: A particle moves along the x axis
Q31: An object dropped from a window of
Q81: The position y of a particle moving
Q82: An object is released from rest.How far