Multiple Choice
Which of the following graphs represents the magnitude of the electric field as a function of the distance from the center of a solid charged conducting sphere of radius R? 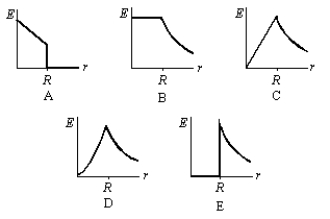
A) A
B) B
C) C
D) D
E) E
Correct Answer:

Verified
Correct Answer:
Verified
Related Questions
Q9: A hollow conductor is positively charged.A small
Q10: A 30-N/C uniform electric field points perpendicularly
Q14: Charge is distributed uniformly along a long
Q18: Positive charge Q is placed on
Q19: A point particle with charge q is
Q20: A long line of charge with
Q24: A solid insulating sphere of radius R
Q27: Two large insulating parallel plates carry charge
Q28: Charge Q is distributed uniformly throughout
Q29: The outer surface of the cardboard center