Multiple Choice
The diagram shows the graphs of the stopping potential as a function of the frequency of the incident light for photoelectric experiments performed on three different materials. Rank the materials according to the values of their work functions, from least to greatest. 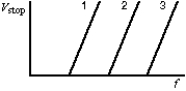
A) 1, 2, 3
B) 3, 2, 1
C) 2, 3, 1
D) 2, 1, 3
E) 1, 3, 2
Correct Answer:

Verified
Correct Answer:
Verified
Q4: A photon in light beam A has
Q7: Separate Compton effect experiments are carried out
Q11: Electromagnetic radiation with a wavelength of 3.5
Q15: A free electron in motion along the
Q43: An electron with energy E is incident
Q44: The frequency and wavelength of the matter
Q47: The stopping potential for electrons ejected by
Q50: A free electron and a free proton
Q53: Which of the following is NOT evidence
Q59: The concentration of photons in a uniform