Multiple Choice
Which of the following graphs represents the magnitude of the electric field as a function of the distance from the center of a solid charged conducting sphere of radius R? 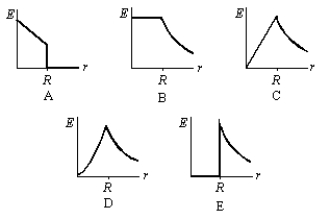
A) A
B) B
C) C
D) D
E) E
Correct Answer:

Verified
Correct Answer:
Verified
Related Questions
Q4: A particle with charge +Q is placed
Q4: A solid insulating sphere of radius R
Q7: Two large insulating parallel plates carry charge
Q13: Charge Q is distributed uniformly throughout
Q26: A particle with charge 5.0 ° C
Q29: A physics instructor in an anteroom charges
Q34: Consider Gauss law: .Which of the following
Q38: A closed cylinder with a 0.15-m radius
Q40: A conducting sphere of radius 0.01 m
Q42: A conducting sphere of radius 5.0 cm