Multiple Choice
This graph shows the angular position of an object as a function of time. What is its average angular velocity between t = 5 s and t = 9 s? 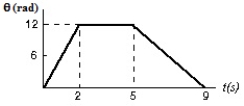
A) 3 rad/s
B) −3 rad/s
C) 12 rad/s
D) −12 rad/s
E) Need additional information.
Correct Answer:

Verified
Correct Answer:
Verified
Related Questions
Q16: Three balls, with masses of 3M, 2M,
Q19: The fan shown has been turned
Q24: A thin circular hoop of mass 1.0
Q26: A small disk of radius R<sub>1</sub> is
Q51: One revolution is the same as:<br>A)"1
Q58: The angular speed of the second
Q64: A wheel starts from rest and
Q74: A disk has a rotational inertia of
Q89: A flywheel is initially rotating at 20
Q91: The angular speed of the minute