Multiple Choice
This graph shows the angular velocity of a turntable as a function of time. What is its average angular acceleration between t = 2 s and t = 4 s? 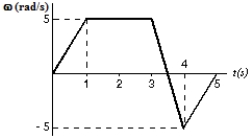
A) −10 rad/s2
B) −5 rad/s2
C) 0 rad/s2
D) 5 rad/s2
E) 10 rad/s2
Correct Answer:

Verified
Correct Answer:
Verified
Related Questions
Q4: The rotational inertia of a disk about
Q6: A force with a given magnitude is
Q43: Four identical particles, each with mass m,
Q46: Consider four objects, each having the same
Q47: This graph shows the angular velocity of
Q49: A pulley with a radius of 3.0
Q53: An object rotates from θ<sub>1</sub> to θ<sub>2</sub>
Q59: A child, riding on a large merry-go-round,
Q63: A wheel initially has an angular velocity
Q98: A disk with a rotational inertia of