Multiple Choice
The diagram shows a plot of the potential energy as a function of x for a particle moving along the x axis. The points of stable equilibrium are: 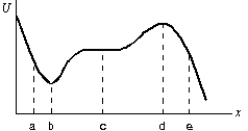
A) only a
B) only b
C) only c
D) only d
E) b and d
Correct Answer:

Verified
Correct Answer:
Verified
Related Questions
Q1: A force of 10 N holds an
Q3: The diagram shows a plot of the
Q7: The diagram shows a plot of the
Q10: As a particle moves along the x
Q16: An ideal spring is used to fire
Q35: Two particles interact by conservative forces.In addition,
Q36: An elevator is rising at constant speed.Consider
Q38: The energy of a system increases at
Q47: A 6.0-kg block is released from rest
Q51: A stationary mass m = 1.3 kg