Multiple Choice
This graph shows the position of a particle as a function of time. What is its average velocity between t = 5s and t = 9s? 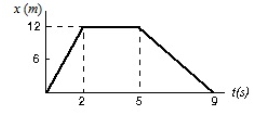
A) 3 m/s
B) -3 m/s
C) 12 m/s
D) -12 m/s
E) Need additional information.
Correct Answer:

Verified
Correct Answer:
Verified
Related Questions
Q13: Can an object have positive acceleration and
Q14: The average speed of a moving object
Q26: An object dropped from a window of
Q40: Displacement can be obtained from:<br>A) the slope
Q41: The diagram shows a velocity-time graph for
Q44: At a location where g = 9.80
Q48: Each of four particles moves along an
Q64: A particle moves from point x<sub>1</sub> to
Q69: An object is thrown vertically upward with
Q78: When can you treat a moving object