Multiple Choice
This graph shows the velocity of a particle as a function of time. During what interval is its displacement negative? 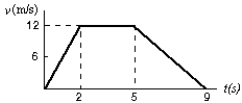
A) 0 - 2 s
B) 2s - 5 s
C) 5 s - 9 s
D) 0 - 9 s
E) Its displacement is not negative between 0 and 9 s.
Correct Answer:

Verified
Correct Answer:
Verified
Related Questions
Q1: Neglecting the effect of air resistance, a
Q15: Which of the following five acceleration versus
Q17: The diagram shows a velocity-time graph for
Q19: A car moving with an initial velocity
Q41: A car starts from Hither, goes 50
Q49: How far does a car travel in
Q56: All falling objects experience some air resistance,
Q72: A stone is released from a balloon
Q75: An object is shot vertically upward.While it
Q88: A racing car traveling with constant acceleration