Multiple Choice
This graph shows the position of a particle as a function of time.What is its average velocity between t = 5s and t = 9s? 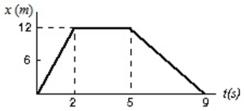
A) 3 m/s
B) -3 m/s
C) 12 m/s
D) -12 m/s
E) Need additional information.
Correct Answer:

Verified
Correct Answer:
Verified
Related Questions
Q29: An object is thrown straight up from
Q30: At time t = 0 a car
Q31: A car starts from Hither, goes 50
Q32: Consider the following five graphs (note the
Q33: What is the relationship between instantaneous speed
Q35: An object starts from rest at the
Q36: Over a short interval near time t
Q37: A heavy ball falls freely, starting from
Q38: A freely falling body has a constant
Q39: Starting at time t = 0, an