Multiple Choice
The diagram shows a plot of the potential energy as a function of x for a particle moving along the x axis.The points of unstable equilibrium are: 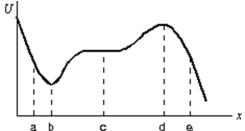
A) only a
B) only b
C) only c
D) only d
E) b and d
Correct Answer:

Verified
Correct Answer:
Verified
Related Questions
Q39: Objects A and B interact with each
Q40: Only if a force on a particle
Q41: A ball is held at a height
Q42: The potential energy of a 0.20-kg particle
Q43: The graphs below show the magnitude of
Q45: A 2-kg block is thrown upward from
Q46: The diagram shows a plot of the
Q47: A 6.0-kg block is released from rest
Q48: A small object of mass m, on
Q49: No kinetic energy is possessed by:<br>A)a shooting