Multiple Choice
Figure 13-3 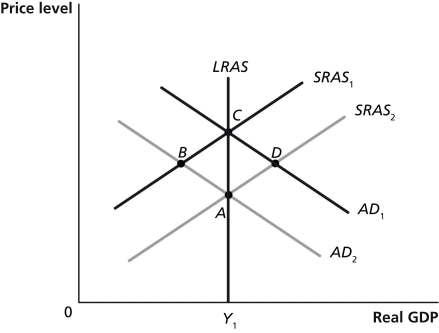
-Refer to Figure 13-3.Which of the points in the above graph are possible long-run equilibria?
A) A and B
B) A and C
C) A and D
D) B and D
Correct Answer:

Verified
Correct Answer:
Verified
Q271: Lower personal income taxes<br>A)increase aggregate demand.<br>B)decrease disposable
Q272: How do changes in income tax policies
Q273: Ceteris paribus,in the long run,a negative supply
Q274: Figure 13-2 <img src="https://d2lvgg3v3hfg70.cloudfront.net/TB1236/.jpg" alt="Figure 13-2
Q275: Workers and firms both expect that prices
Q277: Figure 13-1 <img src="https://d2lvgg3v3hfg70.cloudfront.net/TB1236/.jpg" alt="Figure 13-1
Q278: According to the real business cycle model<br>A)increases
Q279: New classical macroeconomic theory emphasizes the role
Q280: Briefly describe monetarism and the monetary growth
Q281: An increase in disposable income will shift