Multiple Choice
Figure 13-3 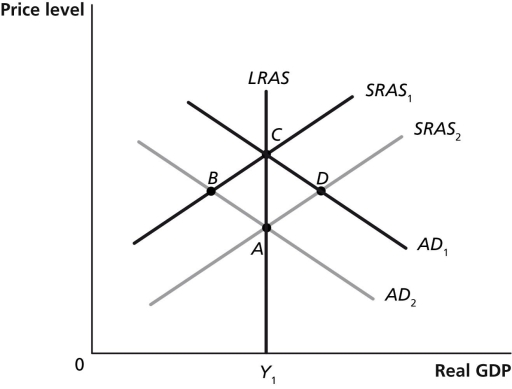
-Refer to Figure 13-3.Which of the points in the above graph are possible short-run equilibria but not long-run equilibria? Assume that Y1 represents potential GDP.
A) A and B
B) A and C
C) C and D
D) B and D
Correct Answer:

Verified
Correct Answer:
Verified
Q13: If aggregate demand just decreased,which of the
Q38: In the dynamic aggregate demand and aggregate
Q53: Changes in the price level<br>A)increase the level
Q59: Which of the following is considered a
Q75: If firms and workers could predict the
Q115: Stagflation usually results from<br>A)a supply shock.<br>B)a decrease
Q172: For the recession of 2007-2009,it took _
Q180: Full-employment GDP is also known as<br>A)realized GDP.<br>B)potential
Q253: Hurricane Katrina destroyed oil and natural gas
Q278: According to the real business cycle model<br>A)increases