Multiple Choice
Figure 13-4 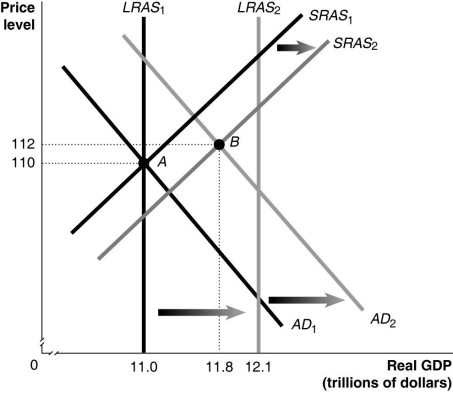
-Refer to Figure 13-4.In the figure above,LRAS1 and SRAS1 denote LRAS and SRAS in year 1,while LRAS2 and SRAS2 denote LRAS and SRAS in year 2.Given the economy is at point A in year 1,what is the growth rate in potential GDP in year 2?
A) 8%
B) 9.1%
C) 10%
D) 12%
Correct Answer:

Verified
Correct Answer:
Verified
Q3: All of the following are reasons why
Q54: The basic aggregate demand and aggregate supply
Q73: Spending on the war in Afghanistan is
Q86: Figure 13-4 <img src="https://d2lvgg3v3hfg70.cloudfront.net/TB1236/.jpg" alt="Figure 13-4
Q125: Workers expect inflation to rise from 3%
Q135: Figure 13-2 <img src="https://d2lvgg3v3hfg70.cloudfront.net/TB4191/.jpg" alt="Figure 13-2
Q151: At a long-run macroeconomic equilibrium,real GDP is
Q196: Which of the following is one reason
Q222: Figure 13-4 <img src="https://d2lvgg3v3hfg70.cloudfront.net/TB1236/.jpg" alt="Figure 13-4
Q240: A rapid increase in the price of