Multiple Choice
Figure 13-4 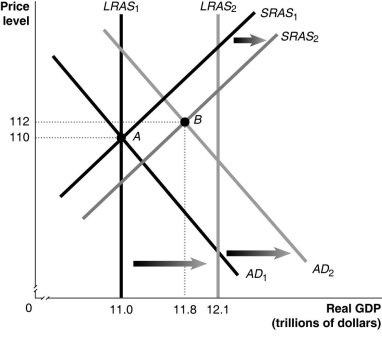
-Refer to Figure 13-4.Given the economy is at point A in year 1,what is the inflation rate between year 1 and year 2?
A) 0.9%
B) 1.8%
C) 2.7%
D) 3.0%
Correct Answer:

Verified
Correct Answer:
Verified
Q81: Why are the long-run effects of an
Q82: Which of the following is one reason
Q83: Using an aggregate demand graph,illustrate the impact
Q84: When the price of oil rises unexpectedly,the
Q85: In the long run<br>A)GDP = potential GDP.<br>B)unemployment
Q87: Using aggregate demand and aggregate supply,explain what
Q88: Figure 13-2 <img src="https://d2lvgg3v3hfg70.cloudfront.net/TB1236/.jpg" alt="Figure 13-2
Q89: The _ curve is vertical.<br>A)short-run aggregate supply<br>B)short-run
Q90: If the economy receives an influx of
Q91: Why does the short-run aggregate supply curve