Multiple Choice
Figure 13-4 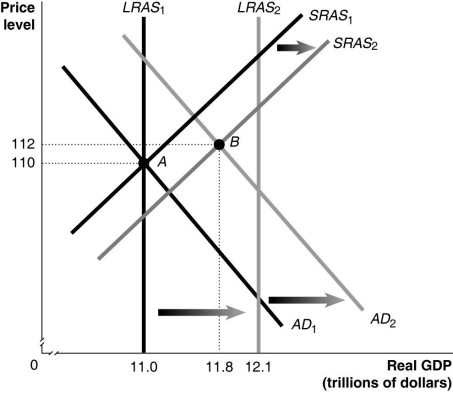
-Refer to Figure 13-4.In the figure above,AD1,LRAS1 and SRAS1 denote AD,LRAS and SRAS in year 1,while AD2,LRAS2 and SRAS2 denote AD,LRAS and SRAS in year 2.Given the economy is at point A in year 1,what is the actual growth rate in GDP in year 2?
A) 2.5%
B) 7.3%
C) 8.0%
D) 10.0%
Correct Answer:

Verified
Correct Answer:
Verified
Q19: Declines in spending on residential construction are
Q24: An increase in government spending will result
Q90: If the economy receives an influx of
Q130: The invention of the integrated circuit by
Q144: Figure 13-1 <img src="https://d2lvgg3v3hfg70.cloudfront.net/TB4191/.jpg" alt="Figure 13-1
Q150: The recession of 2007-2009 made many consumers
Q150: Figure 13-2 <img src="https://d2lvgg3v3hfg70.cloudfront.net/TB4191/.jpg" alt="Figure 13-2
Q160: Using an aggregate demand graph,illustrate the impact
Q161: Which of the following is one explanation
Q187: An increase in the price level shifts