Multiple Choice
Figure 10-1 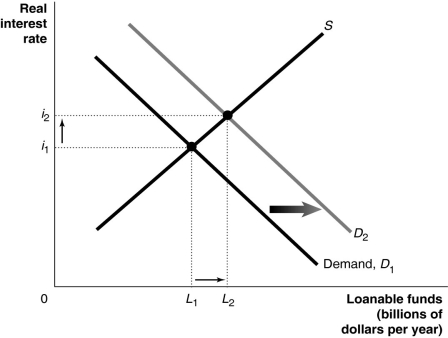
-Refer to Figure 10-1.Which of the following is consistent with the graph depicted above?
A) An expected recession decreases the profitability of new investment.
B) Technological change increases the profitability of new investment.
C) The government runs a budget surplus.
D) Households become spendthrifts and begin to save less.
Correct Answer:

Verified
Correct Answer:
Verified
Q67: Which of the following indicates that the
Q68: From 1950 - 2007,recessions in the United
Q69: How has economist Robert Fogel explained that
Q70: Table 10-2<br> <img src="https://d2lvgg3v3hfg70.cloudfront.net/TB1236/.jpg" alt="Table 10-2
Q71: The demand for loanable funds is downward
Q73: Recessions typically cause the unemployment rate to
Q74: If government purchases are $400 million,taxes are
Q75: Which of the following is not a
Q76: When the economy reaches a trough in
Q77: An increase in government purchases will<br>A)increase public