Multiple Choice
The image below plots the denaturation of ribonuclease A as a function of guanidine hydrochloride (GdnHCl) concentration, monitored by circular dichroism. The shape of the curve in the figure supports which statement? 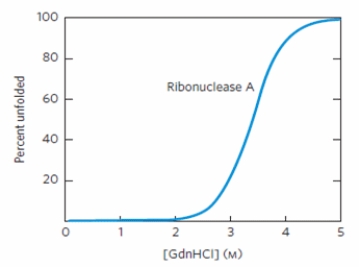
A) The addition of GdnHCl has little effect on protein secondary structure.
B) Increasing temperature causes the protein to become unfolded.
C) Unfolding of this protein is a cooperative process.
D) Ribonuclease A is a heat-stable protein.
E) The peptide bonds of the protein are broken around 3.4 M GdnHCl.
Correct Answer:

Verified
Correct Answer:
Verified
Q53: Describe the resonance structure of a peptide
Q54: Proteins in their functional, folded conformation are
Q55: Which peptide could form an amphipathic
Q56: Proteins are classified within families or superfamilies
Q57: Which method would be MOST useful to
Q59: Which factor is NOT known to be
Q60: A protein is highly unlikely to
Q61: Experiments on denaturation and renaturation after the
Q62: What are two mechanisms by which "chaperone"
Q63: Which amino acid is MOST likely to