Multiple Choice
Using Figure 1 above, if the aggregate demand curve shifts from AD2 to AD3 the result in the long run would be: 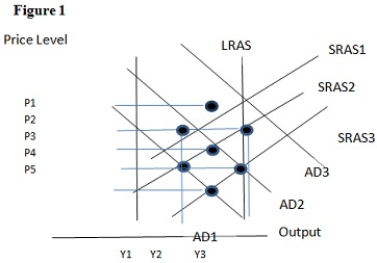
A) P1 and Y2.
B) P2 and Y2.
C) P1 and Y1.
D) P4 and Y2.
Correct Answer:

Verified
Correct Answer:
Verified
Related Questions
Q1: The long-run aggregate supply curve represents:<br>A) potential
Q96: Which of the follow is not a
Q98: In the macroeconomic model of aggregate supply
Q99: The long-run result of government intervention in
Q100: Temporary supply shocks:<br>A) are significant events that
Q102: The effect of a shift in the
Q103: The relationship between the overall price level
Q104: The long-run aggregate supply curve is:<br>A) downward-sloping.<br>B)
Q105: An asset-price bubble is caused by:<br>A) people
Q106: An increase in the costs of production