Multiple Choice
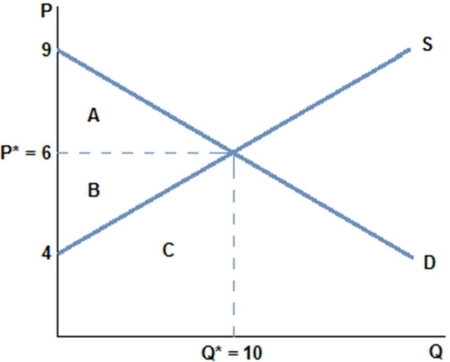 According to the graph shown, consumer surplus is:
A) $10.
B) $15.
C) $20.
D) $30.
Correct Answer:

Verified
Correct Answer:
Verified
Q10: Well-being can be increased by:<br>A) policies that
Q11: Deadweight loss:<br>A) creates efficiency in markets.<br>B) is
Q64: When a perfectly competitive,well-functioning market is in
Q65: Willingness to pay represents:<br>A) the point at
Q94: Markets can be missing:<br>A) because a market
Q97: Assume a market price gets set artificially
Q102: A market has four individuals,each considering buying
Q115: When a perfectly competitive,well-functioning market is not
Q116: <img src="https://d2lvgg3v3hfg70.cloudfront.net/TB6625/.jpg" alt=" According to the
Q121: <img src="https://d2lvgg3v3hfg70.cloudfront.net/TB6625/.jpg" alt=" Assume the market